
Precise Chart Analysis in Seconds
Stop guessing entries. Search any trading pair on our live chart and get AI-driven analysis with precise entry zones, stop loss, and take profit levels.
- Tired of losing money on entries that 'felt right'?
- Staring at charts for hours and still pulling the trigger too late?
- Placing stop losses that get hunted every single time?
- Watching your account bleed because you can't find the right levels?
You don't have a strategy problem — you have a confidence problem. Graphna gives you a built-in second opinion on every chart: precise entry zones, stop losses, and take profit levels — so you stop guessing and start trading with clarity.
Search any trading pair on our live chart — pick from 100+ pairs. Get instant, objective analysis on entry zones, stop losses, and take profit targets — before you risk a single dollar.
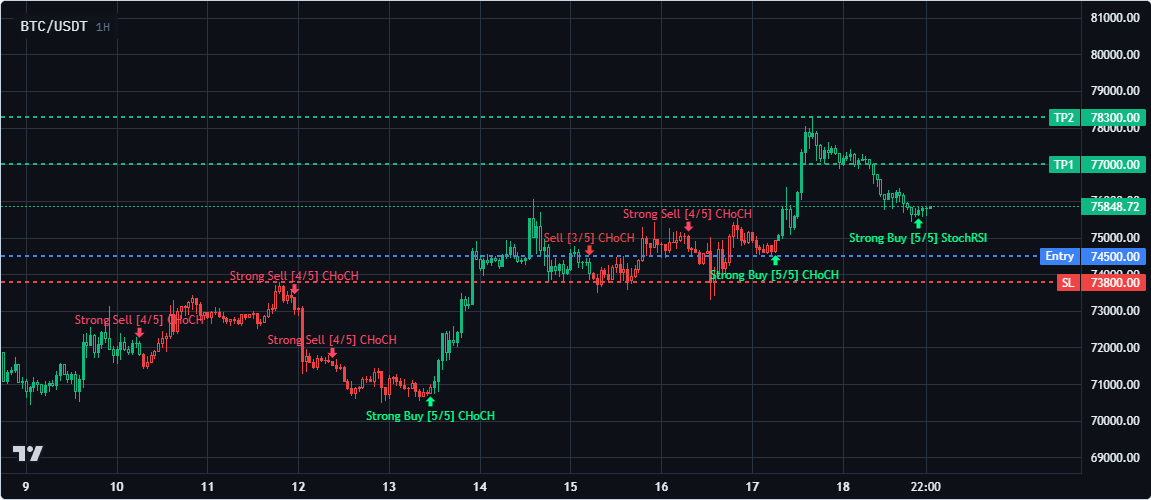
Strong bullish momentum with CHoCH confirmation and StochRSI crossover on 1H timeframe.
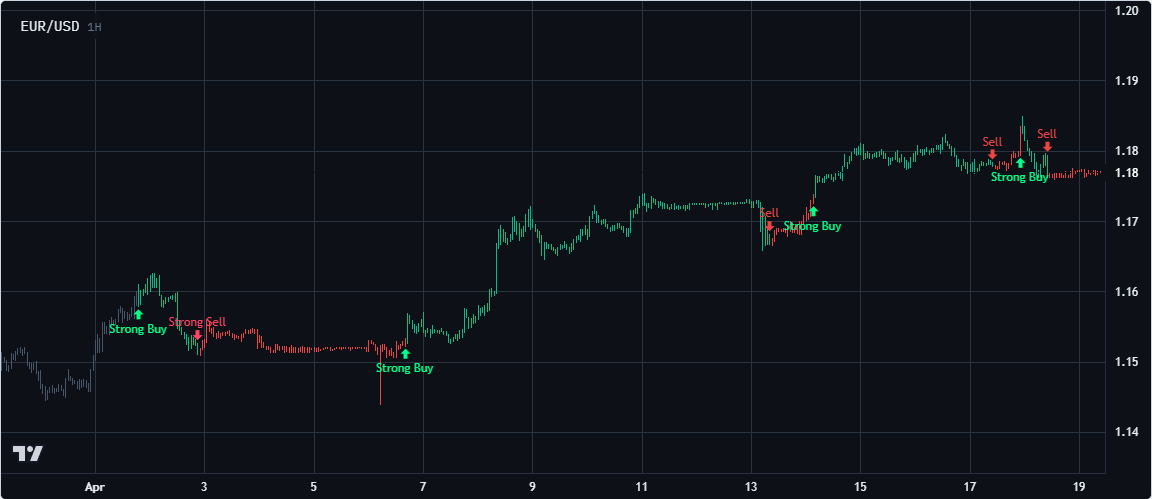
Real AI analysis from live charts with built-in signals
Trusted by Traders Worldwide






Meet Your New Trade Desk Assistant
From live chart to structured trade plan in seconds.
1. Pick Your Chart
Search any trading pair and use our built-in live chart for any market — Forex, Crypto, Stocks, and more. Add optional context like your timeframe or specific questions.
2. AI Analyzes Everything
Our advanced vision models read price action, identify key support/resistance levels, detect patterns, measure momentum — and cross-reference across multiple technical frameworks.
3. Get Your Trade Plan
Receive a clear, structured verdict: Long, Short, or No Trade — complete with exact entry zones, stop loss levels, and take profit targets.
Analyze Any Market
From forex pairs to crypto, stocks, indices, and commodities — search any pair on our live chart.
Key Levels
Entry Strategy
LONG entry zone: 1.0880-1.0900
SL: 1.0850
TP1: 1.0950 | TP2: 1.1000
Real-time analysis terminal preview
Why Traders Are Switching to Graphna
Zero Emotional Bias
AI doesn't get FOMO. It doesn't revenge trade. Every analysis is cold, calculated, and based purely on what the chart is showing.
Institutional-Grade Precision
Our models identify hidden liquidity zones, order blocks, and institutional levels that retail indicators completely miss.
Risk Management Built In
Every setup comes with calculated Stop Loss levels based on actual market structure and volatility — not arbitrary percentages.
Multi-Timeframe Context
The AI doesn't just look at one timeframe. It understands the macro trend and gives you micro execution triggers within the bigger picture.
The Old Way vs. The Graphna Way
| Manual Trading | With Graphna | |
|---|---|---|
| Analysis Speed | 15-30 min | Under 5 seconds |
| Buy/Sell Signals | Manual chart reading | Built-in on every chart |
| Emotional Bias | High - FOMO, fear, revenge | Zero - pure price action |
| Stop Loss Placement | Arbitrary / obvious levels | Structure-based, volatility-adjusted |
| Consistency | Varies with mood and fatigue | 100% consistent, every single time |
| Pattern Recognition | Manual scanning | AI-powered detection |
| Risk:Reward Calculation | Guesswork | Automatically calculated |
| Multi-Timeframe Analysis | Time-consuming | Instant |
| Availability | Limited hours | 24/7 |
Simple, Transparent Pricing
$1 for your first month. Cancel anytime.
Starter
Pro
Elite
30-Day Money-Back Guarantee
If Graphna doesn't improve your trading within 30 days, we'll refund you in full — no questions asked. That's how confident we are in our AI.
Frequently Asked Questions
Ready to Trade with an Edge?
Join thousands of traders who replaced guesswork with precision.
Get Your First Month for $1 →Trading involves significant risk of loss. Graphna provides technical analysis, not financial advice. Past performance is not indicative of future results.